Clocking PVC cannon speed

•August 7, 2010 • 3 Comments

Fairly involved process when you don’t have a radar gun. But possible.

Procedure:

Fire projectile a total distance of 24.5ft. Record the shot with video and sound. Analyze sound waveform to find firing time and projectile impact time. Here is the setup.

To accurately model the velocity of the projectile, assume that while the projectile is in the tube, it is accelerating at a constant rate. Then assume that this velocity is maintained until it makes contact with the target (which is quite incorrect. Therefore, this models the average velocity after the projectile leaves the tube).

Total time was found by analyzing this waveform (peaks indicate the two “thuds.” Thuds are verified by listening to the waveform:

Assignment of variables:

-Any subscript of 1 will pertain to the interval when the projectile is in the tube.
-Any subscript of 2 will pertain to the interval when the projectile has left the tube.
-Any subscript of 3 will pertain to the combination of the first interval and the second interval.

Known Variables:

D1 = 10ft
D3 = 24.5ft
D2 = 14.5ft
T3 = .119 sec

Relationship between distance:

D1 + D2 = D3

Substitute velocity and time for distance:

V1T1 + V2T2 = D3

Assume that V1 = V2/2  (During constant acceleration with zero initial velocity, average velocity is exactly half of the final velocity. Since V1 represents the average velocity while in the tube and V2 represents the final velocity, V1 = V2/2).

Therefore, when substituting for V1:

T1V2/2 + V2T2 = D3

We’re trying to find V2, and we don’t know T1 or T2, so we must use some relationships to figure out what they are.

Relationship 1: T1 + T2 = T3
Relationship 2: V1T1 = D1

We must manipulate relationship 2 to a more useful form (get rid of V1):

V2T1/2 = D1
T1 = 2D1/V2

Now, going back to the original equation:

T1V2/2 + V2T2 = D3

Plug in for T1 and simplify:

2D1*V2/(2*V2) + V2T2 = D3
D1 +V2T2 = D3

Now plug in for T2:

D1 + V2(T3 – T1) = D3

Plug in for T1 again and simplify:

D1 + V2(T3 – 2D1/V2) = D3
D1 + V2T3 – 2D1 = D3

V2 = (D3 + D1)/T3

^^ That’s the equation we were looking for. Elegantly simple if you ask me. Now we can plug in actual data.

V2 = (24.5 + 10)/.119 = 290ft/sec = 198mph.

And just as a reminder, this is the average speed after leaving the tube. Therefore, the velocity when immediately leaving the tube is likely to be significantly higher than the average.

Might explain how it:

-Absolutely destroyed full soda cans
-Went inside a full bike water bottle
-Went all the way through an empty bike water bottle
-Went all the way through an unopened bottle of myoplex.

New adventures with music

•December 20, 2009 • 3 Comments

Yep, finally coming back to the technical blog, after all of this time. Just haven’t had the strength to come up with something during school, so now that its break, I got all the time and energy in the world.

I’ve become more intimately familiar with the concept of the Fourier transform and have a better understanding of the data that would go into an FFT algorithm and the data that comes out. I have a better idea of why all FFT’s are approximations, what their shortcomings are, and when they’re important.

Now, without further gloating, I have some new ideas to get the ball rolling on writing some music. Today I did an experiment with a guitar recording. I recorded me plucking a guitar string and used Audacity’s “Frequency Analysis” feature, which is actually a very nice tool. This is the frequency spectrum (the loudness of each tone) of the recording.

The peaks tell me the tones that the guitar produces. With this information, I can reconstruct an electronic version of the guitar pluck. Basically, I observe the amplitude of each peak, what frequency each peak is, then reconstruct the signal from that.

This is done by the following algorithm (simplified version of the IDFT, does not contain phase angles):

Signal = A1sin(2πf1t) + A2sin(2πf2t) + …

Basically, An represents the height of a particular peak and fn represents the frequency at which the peak occurs.

I used the same C program as before to fabricate the sound. All I did was plug in the numbers I got and ran. It actually worked very well. Compare the recording and the recreation.

********************************************************
Guitar Recording:
click
********************************************************

********************************************************

Guitar Recreation:
click
********************************************************

I think I’m going to spend some time figuring out how I can create an automatic procedure for recording tones, exporting the frequency response raw data, then directly fabricating the sound from the raw data file.

This seems like a nice way to create simple sounds, but there is an issue here involving the short comings of FFT algorithms. The very nature of how a Fourier Transform is calculated makes this whole process a significant approximation. There are two untrue assumptions that explain this.

1.) The signal’s frequency response is not dependent on time.
2.) The signal is sampled during an infinitely long time interval.

Since generally speaking these two things are not true, there are only certain types of sounds that can be fabricated electronically by using the procedure provided in this entry. The best candidates are sounds that do not change much with time and are at least a few seconds in length. Most instruments should be fine candidates since while the instrument is playing a single note, the system is linear (meaning that the frequency response is not changing with time). Even the sound of drums can be recreated since drums are for the most part, linear.

EDIT——————————————————————————————
I inspected the frequency response of me saying “wahhh” and it seems that my explanation for how the mouth filters the sound is inaccurate. When the mouth is open, higher frequencies are propagating more easily. I suppose this could be happening because when the mouth is closed, all you hear is the lower frequency sound penetrating through the throat. Then when the mouth is open, the higher frequencies have a path to get out of the throat.
————————————————————————————————

An example of something that would not work well is a person speaking. The whole process of forming words requires changing tones based on the conventions established by that language. For example, making the “waaahh” sound requires you to sweep from high frequency to low frequency in a particular way. This is done by first producing a tone from the larynx then filtering it with the shape of the mouth. A small mouth starts a “waaah” and a large mouth finishes the “waaah.” A small mouth will only allow higher frequencies to escape because their wavelengths are small enough to allow them to propagate through. As the mouth opens, lower frequencies are allowed out as well.

Disappointments and Excitements

•August 19, 2009 • Leave a Comment

So, as it turns out, looks like I can take back everything I said in the last entry. That’s the bad news. The good news is that all I need to make the bicycle power distribution system is an alternator, a car inverter, and mounting hardware.

The car inverter was already invented to invert the 14V supplied by the alternator. It was also invented with an undervoltage shut-off feature. Therefore, no engineering is necessary except for mechanical. I can get an alternator for $50, an inverter for $100, and mounting hardware for less than $20. That’s it. Done.

It’s cheaper, easier, and I can spend my time looking for a girlfriend. I’m actually kind of relieved.

Human Dynamometer

•August 18, 2009 • Leave a Comment

(I’m warning you, this is very technical. This is a brainstorming post, so I will be talking to myself about very low level topics in order to determine the feasibility of different options. When I have a better idea of how it will work, I will omit certain details and focus on what’s important. Also, I’ll throw in some pictures 😛 )

Don’t know if I’ll really have any time to work on this, but I want to add this to my heap of ideas. Personally, I think its better to have more ideas than time… at least when you get bored with one thing, you can move over to another project. And I never ever want to feel like I don’t know what I want to do with my life. Goals are important.

Now that I’m done blabbing about that, something that I’m really really itching to try is to design a bicycle power generation system using some sort of permanent magnet generator (like a car alternator). Probably the hardest part will be figuring out how to mount the PMG to the cycling trainer or roller set. I have limited access to tools and mechanical design has never been one of my specialties. But, assuming that I can at least get that far, I want to design a PCB that will take the PMG raw power and convert it into regulated 120VAC @ 60Hz. Here’s how I plan to do it.

A permanent magnet generator outputs alternating current at varying amplitude, frequency, and power, depending on how much current the load draws, how fast the generator is spinning, and how much power is provided to the generator, respectively. I won’t go too far into this for now because I want this to be a high level overview.

The point is, the direct power from the generator is not particularly useful. In order to get the frequency of 60Hz, the raw signal must first be rectified (converted to DC), then inverted back into alternating current at 60Hz. Rectification works a lot better with a 3 phase generator, but it can be done with single phase and a large capacitor. It’s just that as more current is drawn, the voltage ripple increases in amplitude because the capacitor will discharge more quickly.

I would rather get my hands on a general purpose 3 phase PMG, but these are usually application specific and thus will probably cost thousands of dollars… whereas I can get a cheap car alternator for about $50. There is a small catch that I never mentioned before. Car alternators are already rectified and regulated at 14V. This means that they will only be useful if I can find a way to remove the rectification stage.

Now… since I’ll be making changes to the alternator in the first place, it may be possible to buy some laminated wire to make my own windings. The windings need to be 120° apart and form little loops at these positions. There’s probably more to it than that, but whatever… I’ll figure it out.

So far, we have:
1.) Generator Makes AC variable frequency, variable amplitude, variable power
2.) Generator power rectified into variable voltage DC with some ripple current

Now we need:
1.) Power inverter/controller

Sounds complicated. It is. Complicated as shit. I plan on using some help from digital control logic, power FETs, and filters. Basically, the digital circuits will “design” the output signal. The power FETs will control the power flow based on the digital control commands. Then the filters will clean up the PWM output of the power FETs to achieve a smooth looking sine wave. Digital circuits require power as well, and I plan on doing this by putting a resistor and a 5V voltage regulator in series with the rectified generator power. Basically, the voltage regulator tries to keep its own voltage at 5V, which is a usable voltage for the digital circuits. It will only work if the rectified generator power is at a high enough voltage. Because of this, I will also install an undervoltage shut-off mechanism that will protect the digital circuits from becoming damaged because of their supply being undervoltage.

This is definitely one of those things where the more money I have available to me, the more legit I can make it. I can figure out how to do everything I’ve mentioned above. The only problem is that the price of some of these components and packaging choices are often not trivial. Actually, packaging usually tends to be the most expensive part of the project. But it all starts with a generator… I suppose for now, I could rectify the 120VAC from the outlet and attempt to condition that. We shall see.

Stuff that blows my mind nice and good

•August 13, 2009 • 2 Comments

It’s really amazing what we overlook sometimes… and quite literally how we think of the world around us, when really, it turns out that its really nothing like what it appears. A co-worker of mine brought to my attention a series of constants called the planck units, which are sometimes called the “Natural Units.” A few examples of these constants include:

1.) planck length = 1.616 x 10⁻³⁵ meters
2.) planck time = 5.391 x 10-44 seconds
3.) planck charge = 1.876 x 10⁻¹⁸ C
4.) planck mass = 2.176 x 10⁻⁸ kg

If instead of meters, seconds, coulombs, and kg, we measured everything using planck units, many fundamental physical constants become a value of 1. These include:

1.) Gravitational constant, G
2.) Speed of light, c
3.) Permittivity of free space, ε0
4.) Permeability of free space, µ0

Let’s talk a little bit about the implications of the planck units. The planck length is currently interpreted as the smallest distance possible in the universe. This conclusion was reached through of a series of experiments that repeatedly demonstrated that a particle’s position cannot be determined to a greater degree of accuracy than one planck length. It is believed that this is so because distances smaller than one planck length do not exist.

Similarly, one planck time is believed to be the smallest increment through which time can progress. So if we extrapolate a bit here; if we take the smallest possible length, and divide it by the shortest possible time, what do we get? Well, my co-worker actually pointed this out to me… the answer is the speed of light.

There it is… holy shit. Quantum mechanics explained why the speed of light is the speed of light. But that’s just the tip of the iceberg.

Then there’s the wave/particle duality of matter. Quantum mechanics says that mass is a vibration. This can be demonstrated by limits of resolution in microscopes. If you’re familiar with microscopes, you may know that they can only work up to a certain magnification. Beyond this level of magnification, no matter how strong the lens is, all objects appear blurry. This occurs on the order of 500nm, which is roughly the smallest wavelength of visible light. Since the wavelength of visible light is about 500nm, it is impossible to measure distances less than 500nm with any degree of certainty. This is demonstrated by the blurriness.

With new advances in research, scientists learned that matter has a vibration. The wavelength of this vibration is determined by the momentum of the matter. If the wavelength becomes shorter, the matter has more momentum. This is just a guess, but scientists maybe discovered that its easier to give matter some momentum, rather than emit high energy light. By shooting electrons at the object desired to be magnified, a process similar to vision is utilized to “see” and magnify the object. Since the electrons have a much smaller wavelength, their resolution is much better and it is possible to magnify objects up to the atomic level. This is called a SEM or scanning electron microscope.

The interpretations of quantum mechanics are limited, due to our limited ability to comprehend all of its properties on a macroscopic scale. Many scientists attempt to interpret the mathematics involved, but some scientists believe that the best way to interpret it is directly through the mathematics. The example of “Schroedinger’s Cat” gives an example of how ludicrous some of the mathematical models are. The joke is that if a cat is known to be alive before being placed in a box, after some time, it is not known if the cat is alive or dead, so it assumed to be both. This joke pokes fun at certain models of particles and was not meant to explain any strange phenomenon. It was just to point out how silly the models were.

Most of quantum mechanics is not well understood. There is still some argument over various things, such as interpretations of the wave/particle duality, the exact mechanics of gravity, and so on. But… until then, I will continue searching.

Can’t Ignore Quantum Mechanics

•August 7, 2009 • 1 Comment

At least in situations involving vacuums. Two things in particular got me going…

1.) If you put a voltage across a vacuum tube, classical physics says that electrons will flow across the gap, no matter how low the voltage is. This has a lot to do with boltzmann probability where electrons randomly receive enough energy to leave their atoms (when the atoms are conductors, such as copper, silver, or gold). This energy is very low in conductors, so you would expect almost all electrons to start jumping the gap. It’s empty space! With an electric field applied! So why doesn’t it work!? Vacuums do indeed have a breakdown voltage, and it is a non-trivial amount of voltage. Its about 500MV/m (http://www.springerlink.com/content/l2j4102131n035q7/).

2.) Let’s say you have two parallel plates and you apply a voltage across those two parallel plates. The parallel plates have capacitance, and applying a voltage across it stores energy. C = Q/V, or capacitance equals charge over voltage. If you keep the same voltage on the capacitors, but increase the distance between them, this lowers the capacitance. The charge stays the same… but then what happens to the voltage??? According to the equation, the voltage increases when you separate the plates! There is a force pulling the plates together when they have opposite charges. If you separate the plates, you have to do work and thus you’re adding energy to the system. Classically speaking, you can expect this to happen if there is air between the plates. Air polarizes in the presence of an electric field. This will in fact make an even larger electric field. Since by moving the plates apart, you’re increasing the volume of air between the plates, this polarizes more of the air and thus increases the electric field. HOWEVER, CLASSICAL PHYSICS DOES NOT PREDICT THAT THIS WORKS IN A VACUUM, BUT IT DOES!!!!!!!!!!

So what does that even mean??? How can energy be stored in a vacuum? These two things seem to suggest that vacuums are a lot more interesting than sir Isaac Newton could have ever imagined…

Measuring Atmospheric E-Fields (Take 2)

•August 5, 2009 • Leave a Comment

I had the luxury of testing out my “lightning probe,” if you will, the day after I installed it. I was, needless to say, very disappointed with the results. I did not notice any arcing and I did not pick up any measurable DC voltages on the probe. In light of these disappointments I figure its a good time to go back to the drawing board and think of another way that I can potentially get some vaguely interesting results from this experiment.

First, I must find a way to calculate the amount of charge that will pass the airgap, and the rate at which this happens. It is possible for charges to flow through an airgap without causing a visible arc. In fact, in any material where an electric field is present, there is always some amount of charge flow. This has a lot to do with probability.  I will not claim to understand these processes, but I will say that they can only be explained by quantum mechanics. It is not a fully understood process since the theory involved is largely dependent on quantum tunneling. But that’s about as far as I’ll go with that. Let’s take baby steps here.

Since I do not have a PhD in electrodynamics, nor access to the research data I need, I will have to do some experimentation. It adds to the fun! I think I have a pretty good idea of what I must do now, but it will present some practical challenges.

In order to get the biggest spark possible, I must find a way to maximize the amount of charge flow through the gap. Charge flow is limited because as charge flows, it will neutralize the electric field between the gap. However, by increasing the CAPACITANCE of the gap, this will increase the amount of charge flow before the electric field gets neutralized.

By definition, Q = V*C, which means that the amount of charge present on a capacitive surface is equal to the voltage times the capacitance. I’m going to assume that 10kV is a fairly common voltage to expect while using my probe during a thunderstorm. I also expect that the arc will end when the voltage drops down to about 5kV. This is purely an approximation from observations on YouTube. As far as charge flow, I’m thinking that I want to see at least 1mA for 1ms. This creates a pretty decent arc. Should be visible enough. 1mA for 1ms is a total charge flow of 1µC. So, now to use the formula:

Q = (dV)*Capacitance
1µC = (10kV – 5kV)*Capacitance
Capacitance = 200pF

This means that the minimum capacitance required to create a 1mA spark for 1ms is 200pF. But, there’s a catch. The capacitor also has to be rated for about 100kV minimum, which drastically changes the picture. I’ll either have to buy a $100 capacitor, or create my own. Creating my own shouldn’t be too hard, but it would have to be HUGE….

C = εA/d

A capacitor is essentially two flat conducting surfaces that are separated by an insulating material. If I were to build one, it would most likely be foam or something similar. This formula means capacitance is equal to the permittivity of the insulating material times the surface area of the capacitor divided by the distance between the two surfaces.

Let’s consider an airgap capacitor:

ε = 8.854pF/m
d ≥ 1cm (must be high enough to prevent dielectric breakdown within the capacitor)

C = εA/d

200pF = (8.854pF)*A/(3cm)

A = .672m2

So this means that I have to place two plates of metal with an area of .672m2 adjacent to each other, separated by 3cm. The area of the plates is about the size of a bike wheel… fairly large. One capacitor plate must be connected to the lightning rod terminal, and the other must be connected to ground.

However, if I use pyrex glass, which has a permittivity of 30 times that of air, plus a much higher dielectric breakdown voltage, I can construct a capacitor that’s roughly the size of a dinner plate. Wow… captain obvious, what should I do?

I can leave my airgap the way it is. The only difference is the addition of the capacitor in parallel to the airgap, which allows the system to capture more of the atmospheric energy. There’s plenty to go around… the discharge of lightning in itself is about 100MJ, which is enough to power about 1 homes for a day.

Here’s the planned setup:

lightning_capBasically, the capacitor is just in parallel to the airgap for the purpose of increasing the amount of energy captured by the system. The hardest part will be constructing the capacitor, and yet, it’s possible using things around the house… as soon as I get some time, I’m going to construct this. Hopefully I’ll get a good thunderstorm before I have to leave for Purdue.

Measuring Atmospheric Electric Fields

•July 27, 2009 • Leave a Comment

Well, apparently I’m not slowing down the EE stuff any time soon. Now that I have a pretty good feeling for electrodynamics, it seems pretty easy to come up with designs and try them out quickly. The only thing that I’m not terribly comfortable with is electromagnetic radiation. I’ve been able to pick up signals, but I don’t truly understand their nature. This will come with time I suppose.

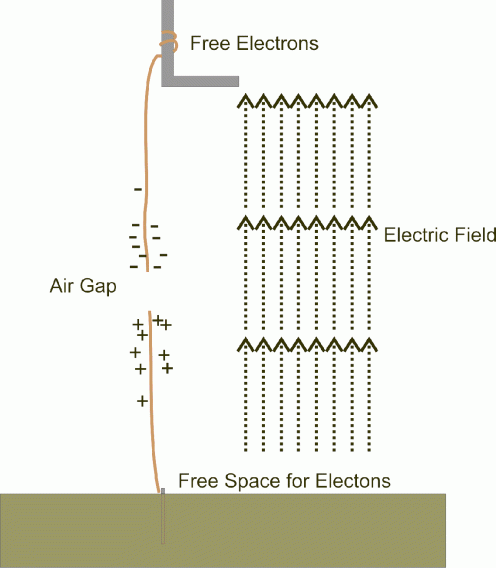
A new experiment I wanted to try is similar to the Gordon’s Bells experiment, but without the bells. I took a steel hinge that weighs about 3 ounces and attached a wire to it. I hung the steel hinge from my second story window using a hook, and ran the wire down to a first story window, outside. There, I took the wire into the window and hooked it up to one side of a spark gap. The other side of the spark gap is connected to another wire, which runs to a 1 foot metal stake, which I nailed into the ground outside.

The point of all of this is my hopes of detecting atmospheric electric fields during thunderstorms, which apparently can reach up to 10kV/m!!!

Since my… I suppose antenna is roughly 5m in the air, that means that the voltage could potentially go up to 50kV during a really good thunderstorm and I may be able to see some pretty awesome sparks jump across the spark gap. But, like always, there are certain subtleties to the implementation that require attention in order to get the results I desire. Like most of the projects I’ve been doing lately, this involves a pretty decent understanding of electricity in terms of charges moving in the presence of electric fields through a vehicle called a copper wire.

One important subtlety is the size of the steel hinge that I’ve decided to attach my wire to. The steel serves as a source of “free electrons.” When there is an electric field from the ground up to the steel hinge, this makes the electrons in the steel travel down the wire. Having enough free electrons ensures that enough electrons will travel down the wire in an attempt to neutralize the electric field.

spark_gap

Since oxygen is an insulator, the electrons are not able to travel across the air gap. This can be compared to an accident during rush hour… Think of yourself as an electron the steel as your place of employment. When its time to go home, you drive down the wire (highway) to get home and SHIT! Traffic! There’s a big ass truck jack-knifed in the middle of the highway. Cars are lined up for miles to get to the other side of the truck.

It’s the same for the electrons, they all want to go to the same place, but they all are stopped by the air gap. So they accumulate there. These charges create a large electric field between the air gap. Oxygen is not a perfect insulator. If the electric field becomes great enough, the oxygen gets stripped of its electrons, thereby increasing the number of free electrons in the oxygen and opening a path for current to flow. Back to the… somewhat flawed analogy, this means that if you’re driving fast enough, you can blow through the jack-knifed trailer and keep going!

The critical electric field is known to be about 3×10⁶V/m. So when we reach this electric field, what should I notice? Well, basically a spark should appear across the gap, indicating that electrons are moving from one side to the other. This continues to happen until the electric field goes below 3×10⁶V/m. My spidey senses tell me that it doesn’t take very long for this to happen, so the spark is very momentary and probably extremely unsatisfying.

I looked at a graph depicting the electric fields measured during the progression of a storm, it appears to go up and down quite often. A spark should jump every time it goes up and then every time it goes down. Looks like it might storm tomorrow, so let’s see what kind of results I get.

It works!

•July 25, 2009 • 2 Comments

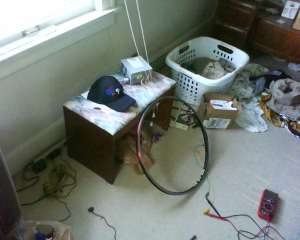
I built an antenna out of my old cracked rim and some magnetic wire and used it to measure the current flowing through the power lines that pass right by my window. I expected to get an answer between 50A and 150A.

Here’s the setup. First is the antenna, second is the power lines. Note the orientation of the antenna to the power lines. It is similar to the orientation of the DVM wires to the lightning in the previous post.

DSC00054DSC00055

The calculations are pretty complicated… I’ll give you the basic idea of what I did though:

1.) Measure the voltage on the antenna using the AC setting on the voltmeter. Assume antenna losses are negligable. This voltage was around .3 – .4 mV AC RMS.
2.) The antenna has 33 wire turns and has an area of .242m2. Use these values to determine the derivative of magnetic flux.
3.) Now, find a relationship between the derivative of magnetic flux and the wire currents. Each wire produces a magnetic field proportional to the current flowing through it. Add up the contributions from each wire, take the derivative, then set it equal to the value found at the antenna. Solve for the current.

Despite some rather rough approximations, I still ended up getting an RMS current of about 90A. Judging by the size of the wire, I would say that seems about right. Sweet!!!!

My next mission is to design a circuit that will measure the antenna voltage and hold the maximum value it records. I’m not yet sure how to do this, but I think it should be doable with what I have. I’m going to use this to do some experiments with lightning if we can get some good storms before I leave. The good thing is I don’t have to take the antenna outside because magnetic fields are not disturbed significantly by houses.

YES!!! My life is so sad sometimes, lol.

EDIT:

I later came up with the idea to listen to the signal coming from the antenna by using my speakers. I noticed that the 60Hz hum was the loudest when in the orientation in which I was taking the measurement. When I turned it 90°, the 60Hz hum was gone and I started picking up some other random noise. This was another level of testing to verify that the magnetic fields I was measuring were actually coming from the wires.

Lightning Experiment (Analysis)

•July 25, 2009 • 1 Comment

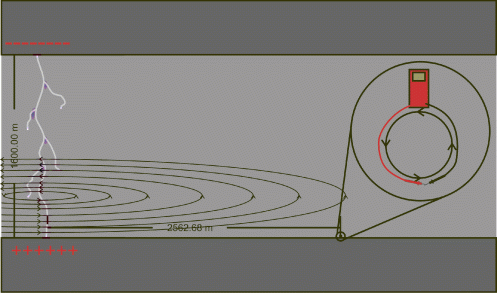
Well, as it turns out, my idea of what I exactly I was trying to measure was completely wrong. Looks like I should have been doing something more like this:

rad_lightning

This is probably one of the most confusing concepts in electromagnetics to understand. But here it goes:

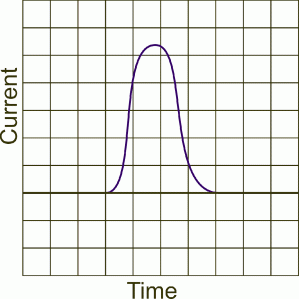
During a lightning strike, a positive current flows from the ground up to the clouds. The current looks something like this:

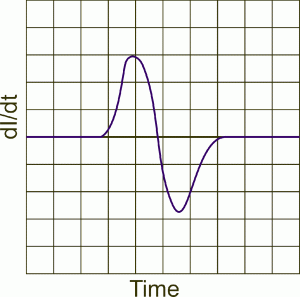
currentd_current

If you refer to the picture of the lightning, I’ve drawn some magnetic field lines that have been induced by the current flow. THE STRENGTH OF THESE MAGNETIC FIELDS IS PROPORTIONAL TO THE CURRENT IN THE LIGHTNING. Unfortunately, I do not have equipment to measure the strength of magnetic fields directly.

I must rely on Maxwell’s law that says that THE CURLY ELECTRIC FIELD IS PROPORTIONAL TO THE DERIVATIVE OF THE MAGNETIC FIELD.

The curly electric field can be measured using the method shown in the first picture. Although, instead of using a DVM, it would be much better to use an oscilloscope since the voltage waveform will look like the derivative of current. You will observe a positive voltage as the lightning current ramps up to its maximum value, then a negative voltage as the lightning current begins to fall.

But let’s forget about my inadequate equipment and focus on what exactly causes the voltage that will be measured and analyzed. Look at how the DVM probe wires are arranged in a circle that is planar to the lightning strike. This allows the magnetic field lines to flow through the hoop. The voltage created along the hoop is proportional to the area of the hoop times the derivative of the magnetic field.

This can be said another way -> the voltage created along the hoop is proportional to the change in magnetic flux through the wire. Think of the hoop as a net that is catching the changing magnetic field. The bigger the net, the more of the magnetic field, and consequently, the more energy that gets absorbed by the field change.

If I had an oscilloscope, I WOULD BE ABLE TO FIND THE CURRENT OF THE LIGHTNING BY INTEGRATING THE VOLTAGE MEASURED ON THE HOOP and multiplying that value by some constant, determined by the distance of the strike, area of the hoop, and relationship between magnetic fields and current. IN ORDER TO DETERMINE THE VOLTAGE, I NEED TO KNOW THE HEIGHT OF THE CLOUDS AND THE STRENGTH OF THE STATIC ELECTRIC FIELD FROM THE GROUND TO SOME POINT IN THE AIR, similar to the bell experiment. In fact, if I were to measure the voltage between bell 1 and bell 2, that would tell me the electric field strength from the ground to the clouds. Using that, I could use the height of the clouds and determine the voltage of the clouds.

With my present setup (using the DVM as shown in the picture above), I will not be able to measure anything useful. However, it may be possible to add peripherals to the loop, such as diodes or amplifiers that will assist in getting a measurable waveform. In fact, that just gave me an idea… More to come on this later…